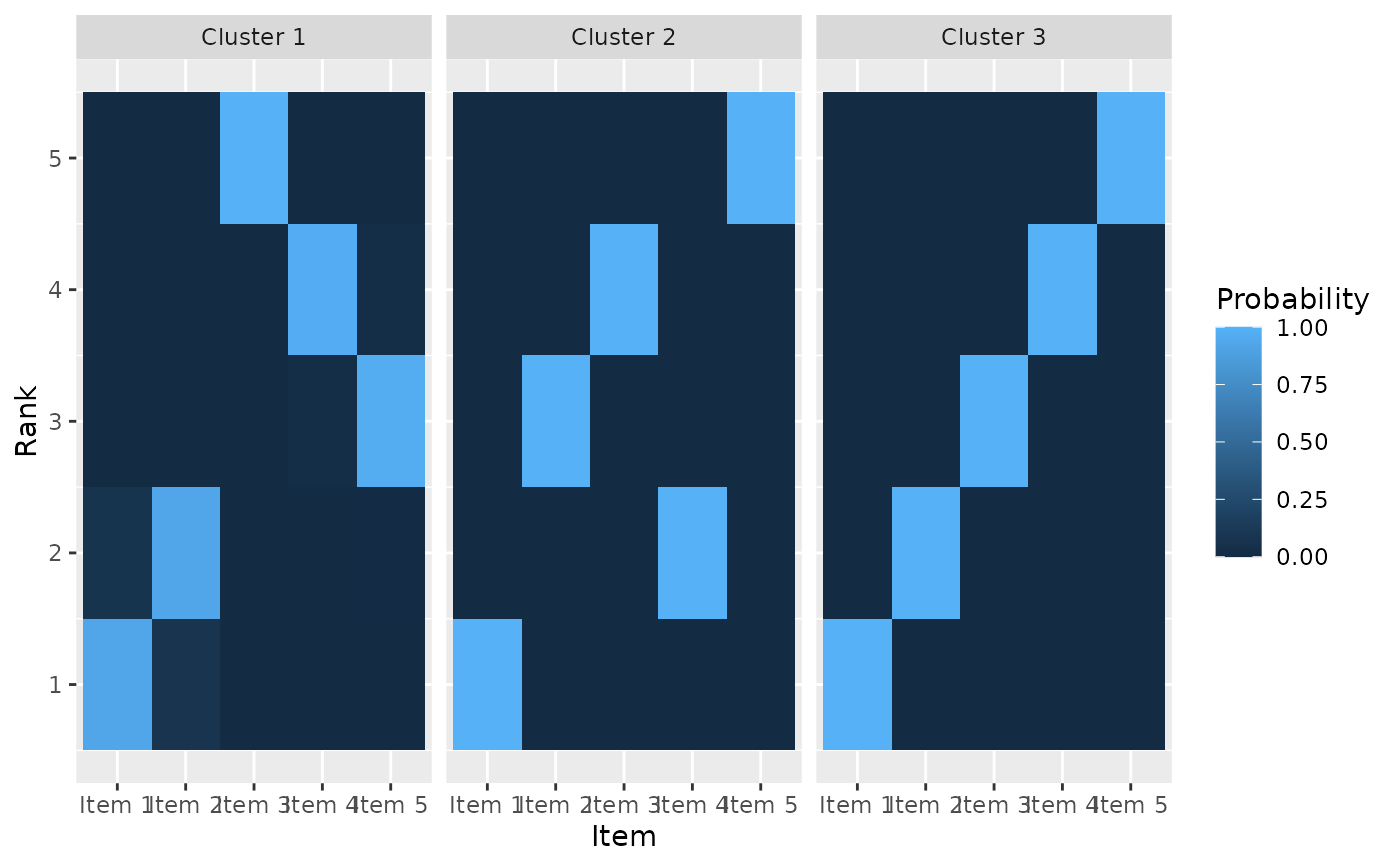
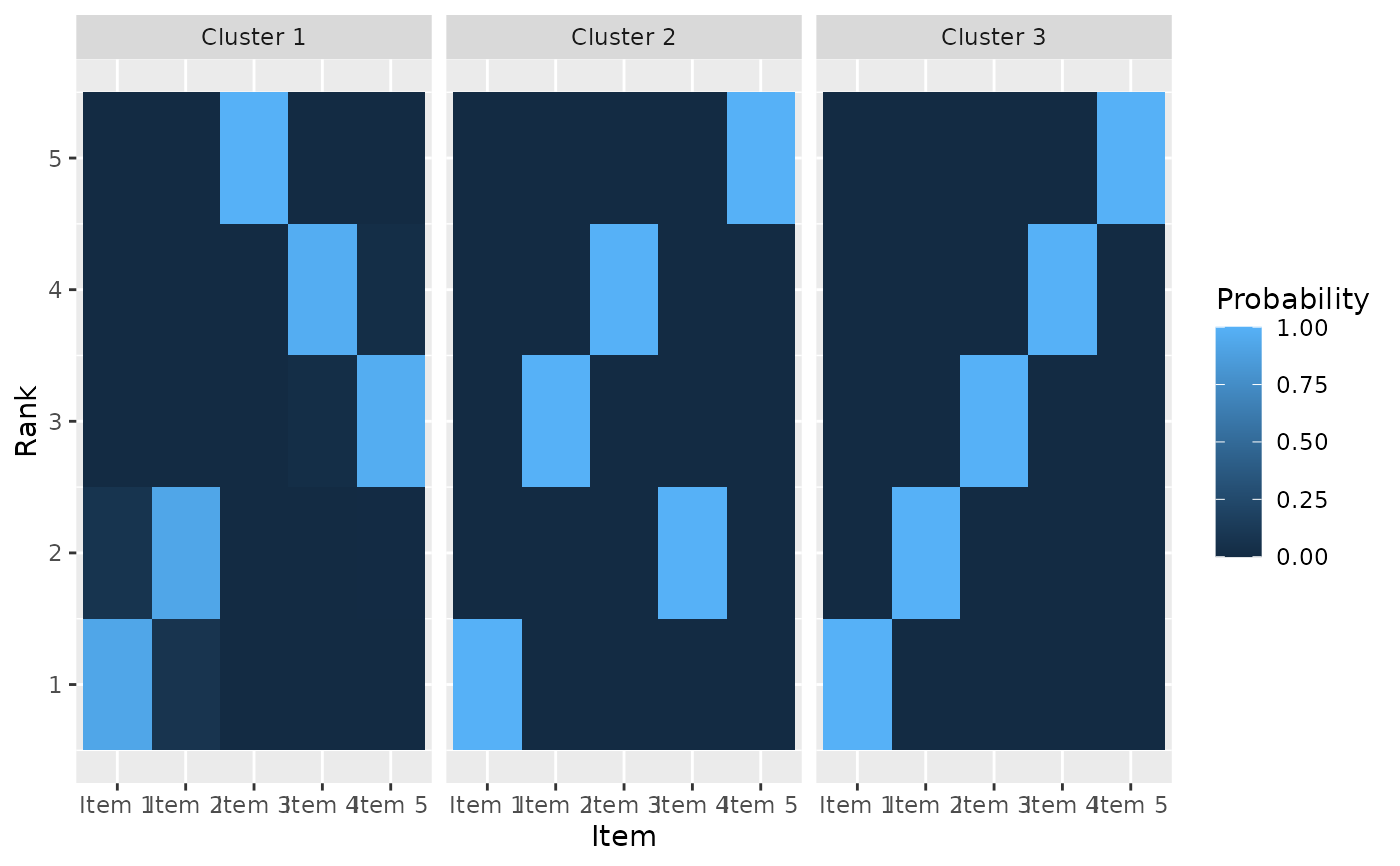
Generates a heat plot with items in their consensus ordering along the horizontal axis and ranking along the vertical axis. The color denotes posterior probability.
Arguments
- model_fit
An object of type
BayesMallows, returned fromcompute_mallows().- ...
Additional arguments passed on to other methods. In particular,
type = "CP"ortype = "MAP"can be passed on tocompute_consensus()to determine the order of items along the horizontal axis.
Details
In models with a single cluster, the items are sorted along the x-axis according to the consensus ranking. In models with more than one cluster, the items are sorted alphabetically.
See also
Other posterior quantities:
assign_cluster(),
compute_consensus(),
compute_posterior_intervals(),
get_acceptance_ratios(),
plot.BayesMallows(),
plot.SMCMallows(),
plot_elbow(),
plot_top_k(),
predict_top_k(),
print.BayesMallows()
Examples
set.seed(1)
model_fit <- compute_mallows(
  setup_rank_data(potato_visual),
  compute_options = set_compute_options(nmc = 2000, burnin = 500))

heat_plot(model_fit)

heat_plot(model_fit, type = "MAP")


## Model with three clusters
mod <- compute_mallows(
  data = setup_rank_data(rankings = cluster_data),
  model_options = set_model_options(n_clusters = 3),
  compute_options = set_compute_options(nmc = 10000, burnin = 1000)
)

heat_plot(mod)

heat_plot(mod, type = "MAP")
